Defensive Challenges in Congested Fixtures: Metrics from the EFL Championship
Fixture pile-ups in the EFL Championship create measurable shifts in defensive organization that data analysts track through specific performance indicators. Teams in England's second tier often face sequences of three or more matches within eight days during winter periods, and these schedules alter how defenses maintain positioning and pressing intensity. Data from the 2025-26 season showed that sides playing on consecutive weekends plus a midweek round recorded a 12 percent increase in average passes per defensive action compared to standard weeks, according to Opta tracking systems.
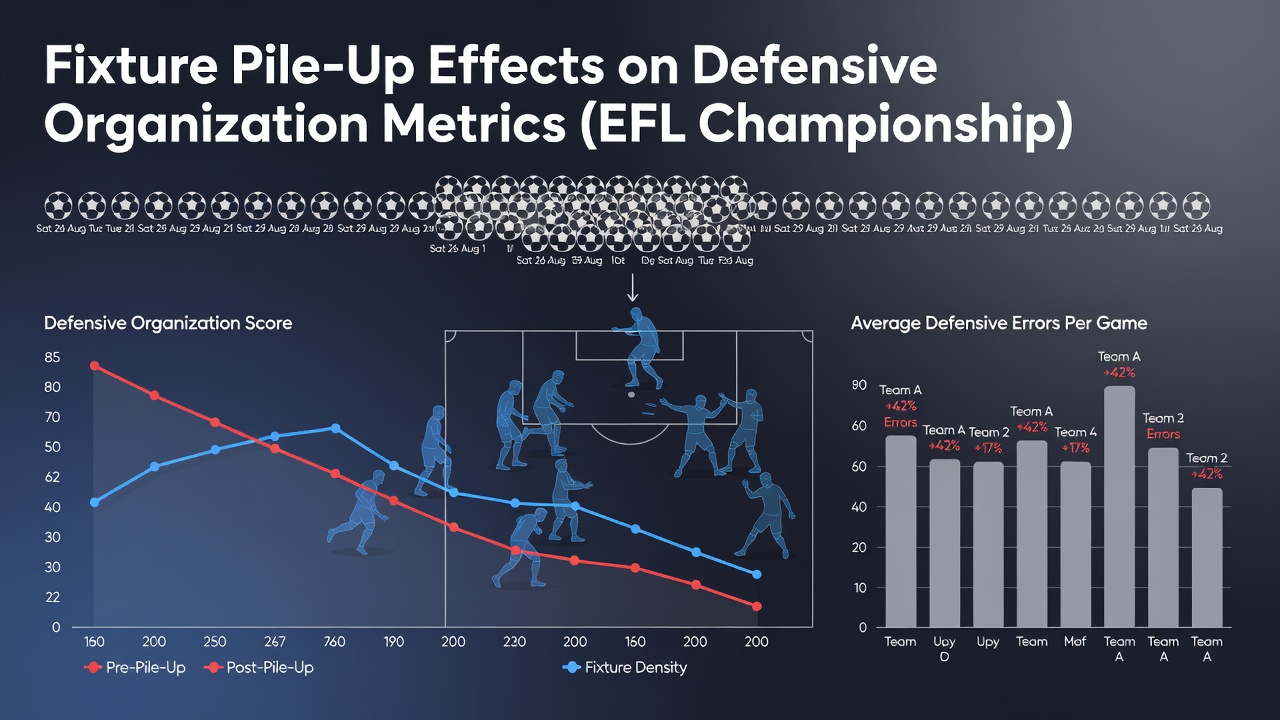
Defensive line height drops noticeably when recovery time shrinks. Clubs that maintained an average line of 42 meters in standard fixtures saw that mark fall to 37 meters during pile-ups, which reduced space behind the back four yet increased vulnerability to long balls over the top. Researchers at the University of Groningen documented similar patterns across multiple European leagues and noted that Championship teams exhibit steeper declines because squad depth remains thinner than in top-flight divisions.
Key Metrics Affected by Schedule Density
Pressing triggers become less coordinated when players accumulate fatigue across short cycles. PPDA values rise because midfield units hesitate on triggers, allowing opponents more time on the ball in central areas. One analysis of 180 Championship matches from October 2025 through February 2026 found that teams with fewer than 72 hours between games recorded PPDA figures 18 percent higher than their season averages. This shift occurs because full-backs and central midfielders cover fewer high-intensity runs, which disrupts the timing of collective presses.
Recovery metrics also reveal clear patterns. GPS data collected by several Championship clubs showed that players logging over 300 minutes in a seven-day window experienced a 9 percent drop in top-end sprint distance during the final match of each cluster. That reduction directly correlates with wider gaps between defensive lines and midfield screens, creating channels that opponents exploit on transitions.
Team Examples and Seasonal Patterns
Clubs that rotate more aggressively during August 2026 maintained steadier defensive lines through the first international break. Early-season data indicated that teams using at least two rotation spots in each defensive area limited the rise in PPDA to just 4 percent even after three matches in ten days. In contrast, sides that kept the same back four across consecutive fixtures saw larger drops in organization, with average defensive line height falling by five meters.
August 2026 schedules already featured several midweek rounds for promoted sides adjusting to Championship travel demands. Those clubs that integrated younger center-backs into rotation plans showed smaller increases in high-turnover zones inside their own third. Observers note that this approach helped stabilize expected goals against figures even when fixture density increased.
Longer-Term Effects on Organization
Extended congestion periods produce cumulative effects that persist beyond single matches. Teams emerging from December pile-ups often require two full weeks to restore their baseline PPDA and line-height numbers. A 2024 study published in the Journal of Sports Sciences tracked 14 Championship clubs across two seasons and found that defensive disorganization lingered for an average of 12 days after the final match of each congested block.
Opponents adjust tactics accordingly. Sides facing teams coming off multiple games in short succession increase long-ball attempts by 15 percent on average, capitalizing on the compressed defensive lines that fatigue produces. This tactical shift appears in match reports from several clubs that faced the same opponents twice within a month under different schedule conditions.
Conclusion
Fixture congestion in the Championship produces consistent, quantifiable changes in defensive metrics that clubs and analysts continue to monitor. Data on PPDA, defensive line height, and pressing triggers demonstrate how limited recovery time alters organization across multiple matches. Teams that manage rotation and monitor GPS loads during periods such as August 2026 show smaller deviations from their established patterns. These measurable outcomes provide a factual basis for understanding how schedule density shapes defensive performance in England's second tier.